Speed Logs Market Size, Share, and Trends Analysis Report
CAGR :

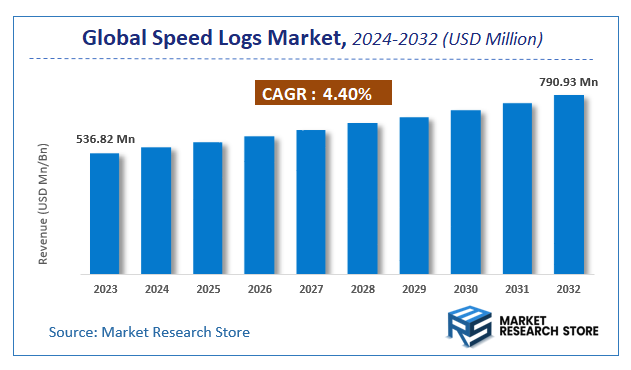
| Market Size 2023 (Base Year) | USD 536.82 Million |
| Market Size 2032 (Forecast Year) | USD 790.93 Million |
| CAGR | 4.4% |
| Forecast Period | 2024 - 2032 |
| Historical Period | 2018 - 2023 |
Speed Logs Market Insights
As per the published report by Market Research Store, the Global Speed Logs Market size was estimated at USD 536.82 Million in 2023 and is anticipated to reach reach USD 790.93 Million by 2032, growing at a projected CAGR of 4.4% during the forecast period 2024-2032. The report provides a detailed analysis of the global Speed Logs Market, including market trends, market dynamics, and market opportunities during the forecast period (2024-2032). It delves deeper into several market facets, such as market definition, size, growth, forecast, segmentation, competitive analysis, growth drivers, restraints, financial analysis, SWOT analysis, PORTER’s five force analysis, PESTEL analysis, market share analysis, cost-benefit analysis, challenges, restraints, strategic recommendations, and market players.
To Get more Insights, Request a Free Sample
Speed Logs Market: Overview
The growth of the speed logs market is fueled by rising global demand across various industries and applications. The report highlights lucrative opportunities, analyzing cost structures, key segments, emerging trends, regional dynamics, and advancements by leading players to provide comprehensive market insights. The speed logs market report offers a detailed industry analysis from 2024 to 2032, combining quantitative and qualitative insights. It examines key factors such as pricing, market penetration, GDP impact, industry dynamics, major players, consumer behavior, and socio-economic conditions. Structured into multiple sections, the report provides a comprehensive perspective on the market from all angles.
Key sections of the speed logs market report include market segments, outlook, competitive landscape, and company profiles. Market Segments offer in-depth details based on Product, Application, and other relevant classifications to support strategic marketing initiatives. Market Outlook thoroughly analyzes market trends, growth drivers, restraints, opportunities, challenges, Porter’s Five Forces framework, macroeconomic factors, value chain analysis, and pricing trends shaping the market now and in the future. The Competitive Landscape and Company Profiles section highlights major players, their strategies, and market positioning to guide investment and business decisions. The report also identifies innovation trends, new business opportunities, and investment prospects for the forecast period.
Key Highlights:
- As per the analysis shared by our research analyst, the global speed logs market is estimated to grow annually at a CAGR of around 4.4% over the forecast period (2024-2032).
- In terms of revenue, the global speed logs market size was valued at around USD 536.82 Million in 2023 and is projected to reach USD 790.93 Million by 2032.
- The market is projected to grow at a significant rate due to increasing maritime safety regulations, demand for precise navigation systems, growth in commercial shipping, and advancements in marine instrumentation technology.
- Based on the Product, the Electromagnetic segment is growing at a high rate and will continue to dominate the global market as per industry projections.
- On the basis of Application, the Passenger Vessels segment is anticipated to command the largest market share.
- Based on region, Europe is projected to dominate the global market during the forecast period.
Speed Logs Market: Report Scope
This report thoroughly analyzes the speed logs market, exploring its historical trends, current state, and future projections. The market estimates presented result from a robust research methodology, incorporating primary research, secondary sources, and expert opinions. These estimates are influenced by the prevailing market dynamics as well as key economic, social, and political factors. Furthermore, the report considers the impact of regulations, government expenditures, and advancements in research and development on the market. Both positive and negative shifts are evaluated to ensure a comprehensive and accurate market outlook.
| Report Attributes | Report Details |
|---|---|
| Report Name | Speed Logs Market |
| Market Size in 2023 | USD 536.82 Million |
| Market Forecast in 2032 | USD 790.93 Million |
| Growth Rate | CAGR of 4.4% |
| Number of Pages | 174 |
| Key Companies Covered | Faria, Gaffrig, Veethree Electronics and Marine LLC, Wema System, Nasa Marine, Cruzpro, Raymarine, APM TECHNOLOGIES, JRC |
| Segments Covered | By Product, By Application, and By Region |
| Regions Covered | North America, Europe, Asia Pacific (APAC), Latin America, Middle East, and Africa (MEA) |
| Base Year | 2023 |
| Historical Year | 2018 to 2023 |
| Forecast Year | 2024 to 2032 |
| Customization Scope | Avail customized purchase options to meet your exact research needs. Request For Customization |
Speed Logs Market: Dynamics
Key Growth Drivers:
The speed logs market is primarily driven by the increasing demand for accurate navigation and vessel performance monitoring in the maritime industry. The growing emphasis on fuel efficiency and voyage optimization is compelling ship operators to invest in advanced speed log systems that provide precise speed and distance measurements. The rise in maritime trade and the expansion of the global shipping fleet are also contributing to market growth. Furthermore, the increasing adoption of electronic navigation systems and integrated bridge systems is driving the demand for compatible speed log technologies. The development of advanced speed logs with features like Doppler technology and GPS integration is enhancing accuracy and reliability, further boosting market expansion.
Restraints:
The speed logs market faces restraints due to the high cost of advanced speed log systems, particularly those with Doppler and GPS integration. Economic uncertainties and budgetary constraints in the maritime industry can delay or hinder investments in new equipment. The need for specialized installation and calibration services can increase operational costs. The complexity of integrating speed log systems with existing navigation and bridge systems can pose technical challenges. Furthermore, the vulnerability of speed log sensors to fouling and damage in harsh marine environments can impact accuracy and reliability. The development of alternative navigation technologies, such as satellite-based systems, may also pose a threat to the traditional speed log market.
Opportunities:
The speed logs market presents numerous opportunities for innovation and growth. The development of smart speed logs with IoT connectivity and remote monitoring capabilities can enhance vessel performance analysis and predictive maintenance. The integration of artificial intelligence (AI) and machine learning (ML) can improve speed log accuracy and provide real-time data insights for voyage optimization. The growing adoption of autonomous and unmanned vessels is creating demand for highly reliable and precise speed log systems. The development of eco-friendly speed logs that minimize environmental impact, such as those with reduced power consumption and biodegradable components, is a significant area of opportunity. Furthermore, the expansion of offshore wind farms and other marine renewable energy projects is creating demand for specialized speed logs for support vessels and installation equipment.
Challenges:
The speed logs market faces challenges related to ensuring high accuracy and reliability in diverse operating conditions, including varying water depths, currents, and vessel speeds. Meeting stringent regulatory requirements and international standards, such as those related to navigation safety and performance, is crucial for market access. Balancing cost-effectiveness with advanced features and functionality is a significant challenge for manufacturers. The need to provide comprehensive technical support and training to ship operators and navigation personnel is essential for proper installation and maintenance. Furthermore, managing supply chain disruptions and ensuring timely delivery of components can be challenging, particularly in a globalized market. The increasing need for cyber security, as these devices are becoming more interconnected, is also a challenge.
Speed Logs Market: Segmentation Insights
The global speed logs market is segmented based on Product, Application, and Region. All the segments of the speed logs market have been analyzed based on present & future trends and the market is estimated from 2024 to 2032.
Based on Product, the global speed logs market is divided into Electromagnetic, Doppler, Pitometer, Impeller, GPS (Global Positioning System).
On the basis of Application, the global speed logs market is bifurcated into Passenger Vessels, Merchant Vessels, Offshore Vessels, Naval Vessels.
Speed Logs Market: Regional Insights
The Speed Logs Market is experiencing significant regional variations, with North America emerging as the dominant region due to advanced maritime technology adoption, strong defense and commercial shipping sectors, and stringent regulatory standards. According to recent market reports, North America holds the largest market share (around 35-40%), driven by the U.S. and Canada’s investments in naval modernization and offshore exploration.
Europe follows closely, benefiting from robust shipbuilding industries in Germany, Norway, and the Netherlands, while the Asia-Pacific region is the fastest-growing market, fueled by increasing maritime trade in China, South Korea, and Japan. The Middle East & Africa and Latin America show steady growth, supported by port expansions and rising naval activities. North America’s dominance is further reinforced by key players like Raytheon Technologies and Teledyne Marine, alongside high R&D investments in Doppler and electromagnetic speed logs.
Speed Logs Market: Competitive Landscape
The speed logs market report offers a thorough analysis of both established and emerging players within the market. It includes a detailed list of key companies, categorized based on the types of products they offer and other relevant factors. The report also highlights the market entry year for each player, providing further context for the research analysis.
The "Global Speed Logs Market" study offers valuable insights, focusing on the global market landscape, with an emphasis on major industry players such as;
- Faria
- Gaffrig
- Veethree Electronics and Marine LLC
- Wema System
- Nasa Marine
- Cruzpro
- Raymarine
- APM TECHNOLOGIES
- JRC
The Global Speed Logs Market is Segmented as Follows:
By Product
- Electromagnetic
- Doppler
- Pitometer
- Impeller
- GPS (Global Positioning System)
By Application
- Passenger Vessels
- Merchant Vessels
- Offshore Vessels
- Naval Vessels
By Region
- North America
- The U.S.
- Canada
- Mexico
- Europe
- France
- The UK
- Spain
- Germany
- Italy
- Rest of Europe
- Asia Pacific
- China
- Japan
- India
- Australia
- South Korea
- Rest of Asia Pacific
- The Middle East & Africa
- Saudi Arabia
- UAE
- Egypt
- Kuwait
- South Africa
- Rest of the Middle East & Africa
- Latin America
- Brazil
- Argentina
- Rest of Latin America
Market Evolution
This section evaluates the market position of the product or service by examining its development pathway and competitive dynamics. It provides a detailed overview of the product's growth stages, including the early (historical) phase, the mid-stage, and anticipated future advancements influenced by innovation and emerging technologies.
Porter’s Analysis
Porter’s Five Forces framework offers a strategic lens for assessing competitor behavior and the positioning of key players in the speed logs industry. This section explores the external factors shaping competitive dynamics and influencing market strategies in the years ahead. The analysis focuses on five critical forces:
- Competitive Rivalry
- Threat of New Entrants
- Threat of Substitutes
- Supplier Bargaining Power
- Buyer Bargaining Power
Value Chain & Market Attractiveness Analysis
The value chain analysis helps businesses optimize operations by mapping the product flow from suppliers to end consumers, identifying opportunities to streamline processes and gain a competitive edge. Segment-wise market attractiveness analysis evaluates key dimensions like product categories, demographics, and regions, assessing growth potential, market size, and profitability. This enables businesses to focus resources on high-potential segments for better ROI and long-term value.
PESTEL Analysis
PESTEL analysis is a powerful tool in market research reports that enhances market understanding by systematically examining the external macro-environmental factors influencing a business or industry. The acronym stands for Political, Economic, Social, Technological, Environmental, and Legal factors. By evaluating these dimensions, PESTEL analysis provides a comprehensive overview of the broader context within which a market operates, helping businesses identify potential opportunities and threats.
- Political factors assess government policies, stability, trade regulations, and political risks that could impact market operations.
- Economic factors examine variables like inflation, exchange rates, economic growth, and consumer spending power to determine market viability.
- Social factors explore cultural trends, demographics, and lifestyle changes that shape consumer behavior and preferences.
- Technological factors evaluate innovation, R&D, and technological advancements affecting product development and operational efficiencies.
- Environmental factors focus on sustainability, climate change impacts, and eco-friendly practices shaping market trends.
- Legal factors address compliance requirements, industry regulations, and intellectual property laws impacting market entry and operations.
Import-Export Analysis & Pricing Analysis
An import-export analysis is vital for market research, revealing global trade dynamics, trends, and opportunities. It examines trade volumes, product categories, and regional competitiveness, offering insights into supply chains and market demand. This section also analyzes past and future pricing trends, helping businesses optimize strategies and enabling consumers to assess product value effectively.
Speed Logs Market: Company Profiles
The report identifies key players in the speed logs market through competitive landscape and company profiles, evaluating their offerings, financial performance, strategies, and market positioning. It includes a SWOT analysis of the top 3-5 companies, assessing strengths, weaknesses, opportunities, and threats. The competitive landscape highlights rankings, recent activities (mergers, acquisitions, partnerships, product launches), and regional footprints using the Ace matrix. Customization is available to meet client-specific needs.
Regional & Industry Footprint
This section details the geographic reach, sales networks, and market penetration of companies profiled in the speed logs report, showcasing their operations and distribution across regions. It analyzes the alignment of companies with specific industry verticals, highlighting the industries they serve and the scope of their products and services within those sectors.
Ace Matrix
This section categorizes companies into four distinct groups—Active, Cutting Edge, Innovator, and Emerging—based on their product and business strategies. The evaluation of product strategy focuses on aspects such as the range and depth of offerings, commitment to innovation, product functionalities, and scalability. Key elements like global reach, sector coverage, strategic acquisitions, and long-term growth plans are considered for business strategy. This analysis provides a detailed view of companies' position within the market and highlights their potential for future growth and development.
Research Methodology
The qualitative and quantitative insights for the speed logs market are derived through a multi-faceted research approach, combining input from subject matter experts, primary research, and secondary data sources. Primary research includes gathering critical information via face-to-face or telephonic interviews, surveys, questionnaires, and feedback from industry professionals, key opinion leaders (KOLs), and customers. Regular interviews with industry experts are conducted to deepen the analysis and reinforce the existing data, ensuring a robust and well-rounded market understanding.
Secondary research for this report was carried out by the Market Research Store team, drawing on a variety of authoritative sources, such as:
- Official company websites, annual reports, financial statements, investor presentations, and SEC filings
- Internal and external proprietary databases, as well as relevant patent and regulatory databases
- Government publications, national statistical databases, and industry-specific market reports
- Media coverage, including news articles, press releases, and webcasts about market participants
- Paid industry databases for detailed market insights
Market Research Store conducted in-depth consultations with various key opinion leaders in the industry, including senior executives from top companies and regional leaders from end-user organizations. This effort aimed to gather critical insights on factors such as the market share of dominant brands in specific countries and regions, along with pricing strategies for products and services.
To determine total sales data, the research team conducted primary interviews across multiple countries with influential stakeholders, including:
- Distributors
- Marketing, Brand, and Product Managers
- Procurement and Production Managers
- Sales and Regional Sales Managers, Country Managers
- Technical Specialists
- C-Level Executives
These subject matter experts, with their extensive industry experience, helped validate and refine the findings. For secondary research, data was sourced from a wide range of materials, including online resources, company annual reports, industry publications, research papers, association reports, and government websites. These various sources provide a comprehensive and well-rounded perspective on the market.
Frequently Asked Questions
Table Of Content
Table of Content 1 Report Overview 1.1 Study Scope 1.2 Key Market Segments 1.3 Regulatory Scenario by Region/Country 1.4 Market Investment Scenario Strategic 1.5 Market Analysis by Type 1.5.1 Global Speed Logs Market Share by Type (2020-2026) 1.5.2 Electromagnetic 1.5.3 Doppler 1.5.4 Pitometer 1.5.5 Impeller 1.5.6 GPS (Global Positioning System) 1.6 Market by Application 1.6.1 Global Speed Logs Market Share by Application (2020-2026) 1.6.2 Passenger Vessels 1.6.3 Merchant Vessels 1.6.4 Offshore Vessels 1.6.5 Naval Vessels 1.7 Speed Logs Industry Development Trends under COVID-19 Outbreak 1.7.1 Global COVID-19 Status Overview 1.7.2 Influence of COVID-19 Outbreak on Speed Logs Industry Development 2. Global Market Growth Trends 2.1 Industry Trends 2.1.1 SWOT Analysis 2.1.2 Porter’s Five Forces Analysis 2.2 Potential Market and Growth Potential Analysis 2.3 Industry News and Policies by Regions 2.3.1 Industry News 2.3.2 Industry Policies 2.4 Industry Trends Under COVID-19 3 Value Chain of Speed Logs Market 3.1 Value Chain Status 3.2 Speed Logs Manufacturing Cost Structure Analysis 3.2.1 Production Process Analysis 3.2.2 Manufacturing Cost Structure of Speed Logs 3.2.3 Labor Cost of Speed Logs 3.2.3.1 Labor Cost of Speed Logs Under COVID-19 3.3 Sales and Marketing Model Analysis 3.4 Downstream Major Customer Analysis (by Region) 3.5 Value Chain Status Under COVID-19 4 Players Profiles 4.1 Cruzpro 4.1.1 Cruzpro Basic Information 4.1.2 Speed Logs Product Profiles, Application and Specification 4.1.3 Cruzpro Speed Logs Market Performance (2015-2020) 4.1.4 Cruzpro Business Overview 4.2 Faria 4.2.1 Faria Basic Information 4.2.2 Speed Logs Product Profiles, Application and Specification 4.2.3 Faria Speed Logs Market Performance (2015-2020) 4.2.4 Faria Business Overview 4.3 Wema System 4.3.1 Wema System Basic Information 4.3.2 Speed Logs Product Profiles, Application and Specification 4.3.3 Wema System Speed Logs Market Performance (2015-2020) 4.3.4 Wema System Business Overview 4.4 Gaffrig 4.4.1 Gaffrig Basic Information 4.4.2 Speed Logs Product Profiles, Application and Specification 4.4.3 Gaffrig Speed Logs Market Performance (2015-2020) 4.4.4 Gaffrig Business Overview 4.5 APM TECHNOLOGIES 4.5.1 APM TECHNOLOGIES Basic Information 4.5.2 Speed Logs Product Profiles, Application and Specification 4.5.3 APM TECHNOLOGIES Speed Logs Market Performance (2015-2020) 4.5.4 APM TECHNOLOGIES Business Overview 4.6 JRC 4.6.1 JRC Basic Information 4.6.2 Speed Logs Product Profiles, Application and Specification 4.6.3 JRC Speed Logs Market Performance (2015-2020) 4.6.4 JRC Business Overview 4.7 Tecnautic 4.7.1 Tecnautic Basic Information 4.7.2 Speed Logs Product Profiles, Application and Specification 4.7.3 Tecnautic Speed Logs Market Performance (2015-2020) 4.7.4 Tecnautic Business Overview 4.8 Raymarine 4.8.1 Raymarine Basic Information 4.8.2 Speed Logs Product Profiles, Application and Specification 4.8.3 Raymarine Speed Logs Market Performance (2015-2020) 4.8.4 Raymarine Business Overview 4.9 Nasa Marine 4.9.1 Nasa Marine Basic Information 4.9.2 Speed Logs Product Profiles, Application and Specification 4.9.3 Nasa Marine Speed Logs Market Performance (2015-2020) 4.9.4 Nasa Marine Business Overview 4.10 Veethree Electronics and Marine LLC 4.10.1 Veethree Electronics and Marine LLC Basic Information 4.10.2 Speed Logs Product Profiles, Application and Specification 4.10.3 Veethree Electronics and Marine LLC Speed Logs Market Performance (2015-2020) 4.10.4 Veethree Electronics and Marine LLC Business Overview 5 Global Speed Logs Market Analysis by Regions 5.1 Global Speed Logs Sales, Revenue and Market Share by Regions 5.1.1 Global Speed Logs Sales by Regions (2015-2020) 5.1.2 Global Speed Logs Revenue by Regions (2015-2020) 5.2 North America Speed Logs Sales and Growth Rate (2015-2020) 5.3 Europe Speed Logs Sales and Growth Rate (2015-2020) 5.4 Asia-Pacific Speed Logs Sales and Growth Rate (2015-2020) 5.5 Middle East and Africa Speed Logs Sales and Growth Rate (2015-2020) 5.6 South America Speed Logs Sales and Growth Rate (2015-2020) 6 North America Speed Logs Market Analysis by Countries 6.1 North America Speed Logs Sales, Revenue and Market Share by Countries 6.1.1 North America Speed Logs Sales by Countries (2015-2020) 6.1.2 North America Speed Logs Revenue by Countries (2015-2020) 6.1.3 North America Speed Logs Market Under COVID-19 6.2 United States Speed Logs Sales and Growth Rate (2015-2020) 6.2.1 United States Speed Logs Market Under COVID-19 6.3 Canada Speed Logs Sales and Growth Rate (2015-2020) 6.4 Mexico Speed Logs Sales and Growth Rate (2015-2020) 7 Europe Speed Logs Market Analysis by Countries 7.1 Europe Speed Logs Sales, Revenue and Market Share by Countries 7.1.1 Europe Speed Logs Sales by Countries (2015-2020) 7.1.2 Europe Speed Logs Revenue by Countries (2015-2020) 7.1.3 Europe Speed Logs Market Under COVID-19 7.2 Germany Speed Logs Sales and Growth Rate (2015-2020) 7.2.1 Germany Speed Logs Market Under COVID-19 7.3 UK Speed Logs Sales and Growth Rate (2015-2020) 7.3.1 UK Speed Logs Market Under COVID-19 7.4 France Speed Logs Sales and Growth Rate (2015-2020) 7.4.1 France Speed Logs Market Under COVID-19 7.5 Italy Speed Logs Sales and Growth Rate (2015-2020) 7.5.1 Italy Speed Logs Market Under COVID-19 7.6 Spain Speed Logs Sales and Growth Rate (2015-2020) 7.6.1 Spain Speed Logs Market Under COVID-19 7.7 Russia Speed Logs Sales and Growth Rate (2015-2020) 7.7.1 Russia Speed Logs Market Under COVID-19 8 Asia-Pacific Speed Logs Market Analysis by Countries 8.1 Asia-Pacific Speed Logs Sales, Revenue and Market Share by Countries 8.1.1 Asia-Pacific Speed Logs Sales by Countries (2015-2020) 8.1.2 Asia-Pacific Speed Logs Revenue by Countries (2015-2020) 8.1.3 Asia-Pacific Speed Logs Market Under COVID-19 8.2 China Speed Logs Sales and Growth Rate (2015-2020) 8.2.1 China Speed Logs Market Under COVID-19 8.3 Japan Speed Logs Sales and Growth Rate (2015-2020) 8.3.1 Japan Speed Logs Market Under COVID-19 8.4 South Korea Speed Logs Sales and Growth Rate (2015-2020) 8.4.1 South Korea Speed Logs Market Under COVID-19 8.5 Australia Speed Logs Sales and Growth Rate (2015-2020) 8.6 India Speed Logs Sales and Growth Rate (2015-2020) 8.6.1 India Speed Logs Market Under COVID-19 8.7 Southeast Asia Speed Logs Sales and Growth Rate (2015-2020) 8.7.1 Southeast Asia Speed Logs Market Under COVID-19 9 Middle East and Africa Speed Logs Market Analysis by Countries 9.1 Middle East and Africa Speed Logs Sales, Revenue and Market Share by Countries 9.1.1 Middle East and Africa Speed Logs Sales by Countries (2015-2020) 9.1.2 Middle East and Africa Speed Logs Revenue by Countries (2015-2020) 9.1.3 Middle East and Africa Speed Logs Market Under COVID-19 9.2 Saudi Arabia Speed Logs Sales and Growth Rate (2015-2020) 9.3 UAE Speed Logs Sales and Growth Rate (2015-2020) 9.4 Egypt Speed Logs Sales and Growth Rate (2015-2020) 9.5 Nigeria Speed Logs Sales and Growth Rate (2015-2020) 9.6 South Africa Speed Logs Sales and Growth Rate (2015-2020) 10 South America Speed Logs Market Analysis by Countries 10.1 South America Speed Logs Sales, Revenue and Market Share by Countries 10.1.1 South America Speed Logs Sales by Countries (2015-2020) 10.1.2 South America Speed Logs Revenue by Countries (2015-2020) 10.1.3 South America Speed Logs Market Under COVID-19 10.2 Brazil Speed Logs Sales and Growth Rate (2015-2020) 10.2.1 Brazil Speed Logs Market Under COVID-19 10.3 Argentina Speed Logs Sales and Growth Rate (2015-2020) 10.4 Columbia Speed Logs Sales and Growth Rate (2015-2020) 10.5 Chile Speed Logs Sales and Growth Rate (2015-2020) 11 Global Speed Logs Market Segment by Types 11.1 Global Speed Logs Sales, Revenue and Market Share by Types (2015-2020) 11.1.1 Global Speed Logs Sales and Market Share by Types (2015-2020) 11.1.2 Global Speed Logs Revenue and Market Share by Types (2015-2020) 11.2 Electromagnetic Sales and Price (2015-2020) 11.3 Doppler Sales and Price (2015-2020) 11.4 Pitometer Sales and Price (2015-2020) 11.5 Impeller Sales and Price (2015-2020) 11.6 GPS (Global Positioning System) Sales and Price (2015-2020) 12 Global Speed Logs Market Segment by Applications 12.1 Global Speed Logs Sales, Revenue and Market Share by Applications (2015-2020) 12.1.1 Global Speed Logs Sales and Market Share by Applications (2015-2020) 12.1.2 Global Speed Logs Revenue and Market Share by Applications (2015-2020) 12.2 Passenger Vessels Sales, Revenue and Growth Rate (2015-2020) 12.3 Merchant Vessels Sales, Revenue and Growth Rate (2015-2020) 12.4 Offshore Vessels Sales, Revenue and Growth Rate (2015-2020) 12.5 Naval Vessels Sales, Revenue and Growth Rate (2015-2020) 13 Speed Logs Market Forecast by Regions (2020-2026) 13.1 Global Speed Logs Sales, Revenue and Growth Rate (2020-2026) 13.2 Speed Logs Market Forecast by Regions (2020-2026) 13.2.1 North America Speed Logs Market Forecast (2020-2026) 13.2.2 Europe Speed Logs Market Forecast (2020-2026) 13.2.3 Asia-Pacific Speed Logs Market Forecast (2020-2026) 13.2.4 Middle East and Africa Speed Logs Market Forecast (2020-2026) 13.2.5 South America Speed Logs Market Forecast (2020-2026) 13.3 Speed Logs Market Forecast by Types (2020-2026) 13.4 Speed Logs Market Forecast by Applications (2020-2026) 13.5 Speed Logs Market Forecast Under COVID-19 14 Appendix 14.1 Methodology 14.2 Research Data Source
Inquiry For Buying
Speed Logs
Request Sample
Speed Logs