Visual Effects Services Market Size, Share, and Trends Analysis Report
CAGR :

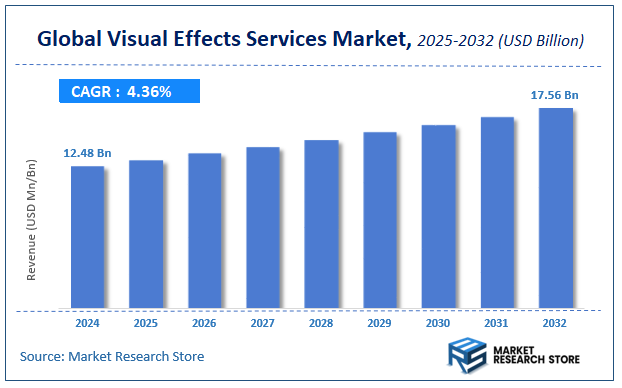
| Market Size 2024 (Base Year) | USD 12.48 Billion |
| Market Size 2032 (Forecast Year) | USD 17.56 Billion |
| CAGR | 4.36% |
| Forecast Period | 2025 - 2032 |
| Historical Period | 2020 - 2024 |
Market Research Store has published a report on the global visual effects services market, estimating its value at USD 12.48 Billion in 2024, with projections indicating it will reach USD 17.56 Billion by the end of 2032. The market is expected to expand at a compound annual growth rate (CAGR) of around 4.36% over the forecast period. The report examines the factors driving market growth, the obstacles that could hinder this expansion, and the opportunities that may emerge in the visual effects services industry. Additionally, it offers a detailed analysis of how these elements will affect demand dynamics and market performance throughout the forecast period.
To Get more Insights, Request a Free Sample
Visual Effects Services Market: Overview
The growth of the visual effects services market is fueled by rising global demand across various industries and applications. The report highlights lucrative opportunities, analyzing cost structures, key segments, emerging trends, regional dynamics, and advancements by leading players to provide comprehensive market insights. The visual effects services market report offers a detailed industry analysis from 2024 to 2032, combining quantitative and qualitative insights. It examines key factors such as pricing, market penetration, GDP impact, industry dynamics, major players, consumer behavior, and socio-economic conditions. Structured into multiple sections, the report provides a comprehensive perspective on the market from all angles.
Key sections of the visual effects services market report include market segments, outlook, competitive landscape, and company profiles. Market Segments offer in-depth details based on Service Type, Application, Technology, End-User, and other relevant classifications to support strategic marketing initiatives. Market Outlook thoroughly analyzes market trends, growth drivers, restraints, opportunities, challenges, Porter’s Five Forces framework, macroeconomic factors, value chain analysis, and pricing trends shaping the market now and in the future. The Competitive Landscape and Company Profiles section highlights major players, their strategies, and market positioning to guide investment and business decisions. The report also identifies innovation trends, new business opportunities, and investment prospects for the forecast period.
Key Highlights:
- As per the analysis shared by our research analyst, the global visual effects services market is estimated to grow annually at a CAGR of around 4.36% over the forecast period (2025-2032).
- In terms of revenue, the global visual effects services market size was valued at around USD 12.48 Billion in 2024 and is projected to reach USD 17.56 Billion by 2032.
- The market is projected to grow at a significant rate due to Increasing demand for CGI in movies, gaming, and advertising, growing adoption of AR/VR technologies, and rising investments in streaming platforms are driving the Visual Effects Services market.
- Based on the Service Type, the Pre-Production segment is growing at a high rate and will continue to dominate the global market as per industry projections.
- On the basis of Application, the Film segment is anticipated to command the largest market share.
- In terms of Technology, the CGI segment is projected to lead the global market.
- By End-User, the Entertainment segment is predicted to dominate the global market.
- Based on region, North America is projected to dominate the global market during the forecast period.
Visual Effects Services Market: Report Scope
This report thoroughly analyzes the visual effects services market, exploring its historical trends, current state, and future projections. The market estimates presented result from a robust research methodology, incorporating primary research, secondary sources, and expert opinions. These estimates are influenced by the prevailing market dynamics as well as key economic, social, and political factors. Furthermore, the report considers the impact of regulations, government expenditures, and advancements in research and development on the market. Both positive and negative shifts are evaluated to ensure a comprehensive and accurate market outlook.
| Report Attributes | Report Details |
|---|---|
| Report Name | Visual Effects Services Market |
| Market Size in 2024 | USD 12.48 Billion |
| Market Forecast in 2032 | USD 17.56 Billion |
| Growth Rate | CAGR of 4.36% |
| Number of Pages | 242 |
| Key Companies Covered | Industrial Light & Magic (ILM), Weta Digital, Framestore, Double Negative (DNEG), MPC (Moving Picture Company), Sony Pictures Imageworks, Digital Domain, Scanline VFX, Rodeo FX, Method Studios, The Mill, Cinesite, Animal Logic, Pixomondo, Luma Pictures, Blur Studio, Tippett Studio, BUF Compagnie, Rising Sun Pictures, FuseFX |
| Segments Covered | By Service Type, By Application, By Technology, By End-User, and By Region |
| Regions Covered | North America, Europe, Asia Pacific (APAC), Latin America, The Middle East and Africa (MEA) |
| Base Year | 2024 |
| Historical Year | 2020 to 2024 |
| Forecast Year | 2025 to 2032 |
| Customization Scope | Avail customized purchase options to meet your exact research needs. Request For Customization |
Visual Effects Services Market: Dynamics
Key Growth Drivers :
The Visual Effects (VFX) Services market is experiencing exponential growth, primarily driven by the insatiable global demand for visually stunning and immersive content across various entertainment platforms. The proliferation of streaming services and cinematic universes necessitates constant innovation in VFX to create fantastical worlds, believable creatures, and breathtaking action sequences. Furthermore, the increasing use of VFX in television series, commercials, and even virtual reality (VR) and augmented reality (AR) experiences expands the market beyond traditional feature films. Technological advancements in CGI, motion capture, and rendering software also enable creators to achieve unprecedented visual realism and complexity, continuously pushing the boundaries of what is possible.
Restraints :
Despite the booming demand, the Visual Effects Services market faces several significant restraints. The incredibly high production costs associated with cutting-edge VFX, involving expensive software, powerful hardware, and highly skilled artists, can be a major barrier for smaller studios or independent productions. The intense global competition, with numerous studios vying for projects, often leads to severe price pressures and "race to the bottom" scenarios, impacting profit margins. Furthermore, the industry is highly reliant on a specialized talent pool, and a shortage of experienced VFX artists, coupled with long working hours and often precarious employment conditions, can hinder growth and innovation. The rapid pace of technological change also demands continuous investment in training and software upgrades, adding to operational costs.
Opportunities :
Opportunities in the Visual Effects Services market are substantial, particularly in leveraging emerging technologies like real-time rendering, virtual production, and AI-powered tools to streamline workflows and reduce costs. Expanding into new content formats, such as interactive experiences, metaverse development, and generative AI content creation, offers significant growth potential. The rising demand for specialized VFX services, such as de-aging actors, digital doubles, or intricate environmental extensions, creates niche markets for highly skilled studios. Furthermore, outsourcing to regions with lower labor costs, while maintaining quality control through advanced remote collaboration tools, can improve cost-efficiency and broaden the talent pool.
Challenges :
The Visual Effects Services market confronts several challenges. Managing complex global pipelines and collaboration across multiple time zones and cultures is a persistent operational hurdle. Ensuring data security and protecting intellectual property for high-value client projects against cyber threats is paramount. The cyclical nature of film and TV production, with projects often having unpredictable schedules and tight deadlines, can lead to significant workload fluctuations and challenges in resource allocation. Additionally, the constant pressure to deliver higher quality visuals within tighter budgets and compressed timelines, while staying abreast of rapidly evolving technological standards, is a continuous and demanding challenge for VFX studios globally.
Visual Effects Services Market: Segmentation Insights
The global visual effects services market is segmented based on Service Type, Application, Technology, End-User, and Region. All the segments of the visual effects services market have been analyzed based on present & future trends and the market is estimated from 2024 to 2032.
Based on Service Type, the global visual effects services market is divided into Pre-Production, Production, Post-Production.
On the basis of Application, the global visual effects services market is bifurcated into Film, Television, Gaming, Advertising, Others.
In terms of Technology, the global visual effects services market is categorized into CGI, Motion Capture, Compositing, Others.
Based on End-User, the global visual effects services market is split into Entertainment, Media, Education, Others.
Visual Effects Services Market: Regional Insights
North America, with the United States at its core, is the dominant region in the global visual effects (VFX) services market. This leadership is driven by the concentration of major film studios, streaming services, and television production companies in Hollywood, which demand a constant and high volume of sophisticated VFX work. The region benefits from the world's highest concentration of leading VFX studios, massive project budgets, and a deep pool of creative and technical talent, solidifying its position as the innovation and revenue leader in the industry.
Visual Effects Services Market: Competitive Landscape
The visual effects services market report offers a thorough analysis of both established and emerging players within the market. It includes a detailed list of key companies, categorized based on the types of products they offer and other relevant factors. The report also highlights the market entry year for each player, providing further context for the research analysis.
The "Global Visual Effects Services Market" study offers valuable insights, focusing on the global market landscape, with an emphasis on major industry players such as;
- Industrial Light & Magic (ILM)
- Weta Digital
- Framestore
- Double Negative (DNEG)
- MPC (Moving Picture Company)
- Sony Pictures Imageworks
- Digital Domain
- Scanline VFX
- Rodeo FX
- Method Studios
- The Mill
- Cinesite
- Animal Logic
- Pixomondo
- Luma Pictures
- Blur Studio
- Tippett Studio
- BUF Compagnie
- Rising Sun Pictures
- FuseFX
The Global Visual Effects Services Market is Segmented as Follows:
By Service Type
- Pre-Production
- Production
- Post-Production
By Application
- Film
- Television
- Gaming
- Advertising
- Others
By Technology
- CGI
- Motion Capture
- Compositing
- Others
By End-User
- Entertainment
- Media
- Education
- Others
By Region
- North America
- The U.S.
- Canada
- Mexico
- Europe
- France
- The UK
- Spain
- Germany
- Italy
- Rest of Europe
- Asia Pacific
- China
- Japan
- India
- Australia
- South Korea
- Rest of Asia Pacific
- The Middle East & Africa
- Saudi Arabia
- UAE
- Egypt
- Kuwait
- South Africa
- Rest of the Middle East & Africa
- Latin America
- Brazil
- Argentina
- Rest of Latin America
Frequently Asked Questions
Table Of Content
Table of Content 1 Report Overview 1.1 Study Scope 1.2 Key Market Segments 1.3 Regulatory Scenario by Region/Country 1.4 Market Investment Scenario Strategic 1.5 Market Analysis by Type 1.5.1 Global Visual Effects Services Market Share by Type (2020-2026) 1.5.2 3D 1.5.3 2D 1.5.4 Other 1.6 Market by Application 1.6.1 Global Visual Effects Services Market Share by Application (2020-2026) 1.6.2 Television 1.6.3 Theatre 1.6.4 Video Game 1.6.5 Simulator 1.6.6 Film 1.7 Visual Effects Services Industry Development Trends under COVID-19 Outbreak 1.7.1 Global COVID-19 Status Overview 1.7.2 Influence of COVID-19 Outbreak on Visual Effects Services Industry Development 2. Global Market Growth Trends 2.1 Industry Trends 2.1.1 SWOT Analysis 2.1.2 Porter’s Five Forces Analysis 2.2 Potential Market and Growth Potential Analysis 2.3 Industry News and Policies by Regions 2.3.1 Industry News 2.3.2 Industry Policies 2.4 Industry Trends Under COVID-19 3 Value Chain of Visual Effects Services Market 3.1 Value Chain Status 3.2 Visual Effects Services Manufacturing Cost Structure Analysis 3.2.1 Production Process Analysis 3.2.2 Manufacturing Cost Structure of Visual Effects Services 3.2.3 Labor Cost of Visual Effects Services 3.2.3.1 Labor Cost of Visual Effects Services Under COVID-19 3.3 Sales and Marketing Model Analysis 3.4 Downstream Major Customer Analysis (by Region) 3.5 Value Chain Status Under COVID-19 4 Players Profiles 4.1 Industrial Light and Magic 4.1.1 Industrial Light and Magic Basic Information 4.1.2 Visual Effects Services Product Profiles, Application and Specification 4.1.3 Industrial Light and Magic Visual Effects Services Market Performance (2015-2020) 4.1.4 Industrial Light and Magic Business Overview 4.2 Weta Digital 4.2.1 Weta Digital Basic Information 4.2.2 Visual Effects Services Product Profiles, Application and Specification 4.2.3 Weta Digital Visual Effects Services Market Performance (2015-2020) 4.2.4 Weta Digital Business Overview 4.3 Image Works 4.3.1 Image Works Basic Information 4.3.2 Visual Effects Services Product Profiles, Application and Specification 4.3.3 Image Works Visual Effects Services Market Performance (2015-2020) 4.3.4 Image Works Business Overview 4.4 Framestore 4.4.1 Framestore Basic Information 4.4.2 Visual Effects Services Product Profiles, Application and Specification 4.4.3 Framestore Visual Effects Services Market Performance (2015-2020) 4.4.4 Framestore Business Overview 4.5 Animal Logic 4.5.1 Animal Logic Basic Information 4.5.2 Visual Effects Services Product Profiles, Application and Specification 4.5.3 Animal Logic Visual Effects Services Market Performance (2015-2020) 4.5.4 Animal Logic Business Overview 4.6 Digital Domain 4.6.1 Digital Domain Basic Information 4.6.2 Visual Effects Services Product Profiles, Application and Specification 4.6.3 Digital Domain Visual Effects Services Market Performance (2015-2020) 4.6.4 Digital Domain Business Overview 4.7 Scanline vfx 4.7.1 Scanline vfx Basic Information 4.7.2 Visual Effects Services Product Profiles, Application and Specification 4.7.3 Scanline vfx Visual Effects Services Market Performance (2015-2020) 4.7.4 Scanline vfx Business Overview 4.8 Cinesite 4.8.1 Cinesite Basic Information 4.8.2 Visual Effects Services Product Profiles, Application and Specification 4.8.3 Cinesite Visual Effects Services Market Performance (2015-2020) 4.8.4 Cinesite Business Overview 4.9 The Mill 4.9.1 The Mill Basic Information 4.9.2 Visual Effects Services Product Profiles, Application and Specification 4.9.3 The Mill Visual Effects Services Market Performance (2015-2020) 4.9.4 The Mill Business Overview 4.10 Digital Idea 4.10.1 Digital Idea Basic Information 4.10.2 Visual Effects Services Product Profiles, Application and Specification 4.10.3 Digital Idea Visual Effects Services Market Performance (2015-2020) 4.10.4 Digital Idea Business Overview 4.11 Silicon Graphics 4.11.1 Silicon Graphics Basic Information 4.11.2 Visual Effects Services Product Profiles, Application and Specification 4.11.3 Silicon Graphics Visual Effects Services Market Performance (2015-2020) 4.11.4 Silicon Graphics Business Overview 4.12 Cinnesite 4.12.1 Cinnesite Basic Information 4.12.2 Visual Effects Services Product Profiles, Application and Specification 4.12.3 Cinnesite Visual Effects Services Market Performance (2015-2020) 4.12.4 Cinnesite Business Overview 4.13 Tippett Studio 4.13.1 Tippett Studio Basic Information 4.13.2 Visual Effects Services Product Profiles, Application and Specification 4.13.3 Tippett Studio Visual Effects Services Market Performance (2015-2020) 4.13.4 Tippett Studio Business Overview 4.14 BUF 4.14.1 BUF Basic Information 4.14.2 Visual Effects Services Product Profiles, Application and Specification 4.14.3 BUF Visual Effects Services Market Performance (2015-2020) 4.14.4 BUF Business Overview 4.15 The Moving Picture Company 4.15.1 The Moving Picture Company Basic Information 4.15.2 Visual Effects Services Product Profiles, Application and Specification 4.15.3 The Moving Picture Company Visual Effects Services Market Performance (2015-2020) 4.15.4 The Moving Picture Company Business Overview 4.16 Double Negative 4.16.1 Double Negative Basic Information 4.16.2 Visual Effects Services Product Profiles, Application and Specification 4.16.3 Double Negative Visual Effects Services Market Performance (2015-2020) 4.16.4 Double Negative Business Overview 5 Global Visual Effects Services Market Analysis by Regions 5.1 Global Visual Effects Services Sales, Revenue and Market Share by Regions 5.1.1 Global Visual Effects Services Sales by Regions (2015-2020) 5.1.2 Global Visual Effects Services Revenue by Regions (2015-2020) 5.2 North America Visual Effects Services Sales and Growth Rate (2015-2020) 5.3 Europe Visual Effects Services Sales and Growth Rate (2015-2020) 5.4 Asia-Pacific Visual Effects Services Sales and Growth Rate (2015-2020) 5.5 Middle East and Africa Visual Effects Services Sales and Growth Rate (2015-2020) 5.6 South America Visual Effects Services Sales and Growth Rate (2015-2020) 6 North America Visual Effects Services Market Analysis by Countries 6.1 North America Visual Effects Services Sales, Revenue and Market Share by Countries 6.1.1 North America Visual Effects Services Sales by Countries (2015-2020) 6.1.2 North America Visual Effects Services Revenue by Countries (2015-2020) 6.1.3 North America Visual Effects Services Market Under COVID-19 6.2 United States Visual Effects Services Sales and Growth Rate (2015-2020) 6.2.1 United States Visual Effects Services Market Under COVID-19 6.3 Canada Visual Effects Services Sales and Growth Rate (2015-2020) 6.4 Mexico Visual Effects Services Sales and Growth Rate (2015-2020) 7 Europe Visual Effects Services Market Analysis by Countries 7.1 Europe Visual Effects Services Sales, Revenue and Market Share by Countries 7.1.1 Europe Visual Effects Services Sales by Countries (2015-2020) 7.1.2 Europe Visual Effects Services Revenue by Countries (2015-2020) 7.1.3 Europe Visual Effects Services Market Under COVID-19 7.2 Germany Visual Effects Services Sales and Growth Rate (2015-2020) 7.2.1 Germany Visual Effects Services Market Under COVID-19 7.3 UK Visual Effects Services Sales and Growth Rate (2015-2020) 7.3.1 UK Visual Effects Services Market Under COVID-19 7.4 France Visual Effects Services Sales and Growth Rate (2015-2020) 7.4.1 France Visual Effects Services Market Under COVID-19 7.5 Italy Visual Effects Services Sales and Growth Rate (2015-2020) 7.5.1 Italy Visual Effects Services Market Under COVID-19 7.6 Spain Visual Effects Services Sales and Growth Rate (2015-2020) 7.6.1 Spain Visual Effects Services Market Under COVID-19 7.7 Russia Visual Effects Services Sales and Growth Rate (2015-2020) 7.7.1 Russia Visual Effects Services Market Under COVID-19 8 Asia-Pacific Visual Effects Services Market Analysis by Countries 8.1 Asia-Pacific Visual Effects Services Sales, Revenue and Market Share by Countries 8.1.1 Asia-Pacific Visual Effects Services Sales by Countries (2015-2020) 8.1.2 Asia-Pacific Visual Effects Services Revenue by Countries (2015-2020) 8.1.3 Asia-Pacific Visual Effects Services Market Under COVID-19 8.2 China Visual Effects Services Sales and Growth Rate (2015-2020) 8.2.1 China Visual Effects Services Market Under COVID-19 8.3 Japan Visual Effects Services Sales and Growth Rate (2015-2020) 8.3.1 Japan Visual Effects Services Market Under COVID-19 8.4 South Korea Visual Effects Services Sales and Growth Rate (2015-2020) 8.4.1 South Korea Visual Effects Services Market Under COVID-19 8.5 Australia Visual Effects Services Sales and Growth Rate (2015-2020) 8.6 India Visual Effects Services Sales and Growth Rate (2015-2020) 8.6.1 India Visual Effects Services Market Under COVID-19 8.7 Southeast Asia Visual Effects Services Sales and Growth Rate (2015-2020) 8.7.1 Southeast Asia Visual Effects Services Market Under COVID-19 9 Middle East and Africa Visual Effects Services Market Analysis by Countries 9.1 Middle East and Africa Visual Effects Services Sales, Revenue and Market Share by Countries 9.1.1 Middle East and Africa Visual Effects Services Sales by Countries (2015-2020) 9.1.2 Middle East and Africa Visual Effects Services Revenue by Countries (2015-2020) 9.1.3 Middle East and Africa Visual Effects Services Market Under COVID-19 9.2 Saudi Arabia Visual Effects Services Sales and Growth Rate (2015-2020) 9.3 UAE Visual Effects Services Sales and Growth Rate (2015-2020) 9.4 Egypt Visual Effects Services Sales and Growth Rate (2015-2020) 9.5 Nigeria Visual Effects Services Sales and Growth Rate (2015-2020) 9.6 South Africa Visual Effects Services Sales and Growth Rate (2015-2020) 10 South America Visual Effects Services Market Analysis by Countries 10.1 South America Visual Effects Services Sales, Revenue and Market Share by Countries 10.1.1 South America Visual Effects Services Sales by Countries (2015-2020) 10.1.2 South America Visual Effects Services Revenue by Countries (2015-2020) 10.1.3 South America Visual Effects Services Market Under COVID-19 10.2 Brazil Visual Effects Services Sales and Growth Rate (2015-2020) 10.2.1 Brazil Visual Effects Services Market Under COVID-19 10.3 Argentina Visual Effects Services Sales and Growth Rate (2015-2020) 10.4 Columbia Visual Effects Services Sales and Growth Rate (2015-2020) 10.5 Chile Visual Effects Services Sales and Growth Rate (2015-2020) 11 Global Visual Effects Services Market Segment by Types 11.1 Global Visual Effects Services Sales, Revenue and Market Share by Types (2015-2020) 11.1.1 Global Visual Effects Services Sales and Market Share by Types (2015-2020) 11.1.2 Global Visual Effects Services Revenue and Market Share by Types (2015-2020) 11.2 3D Sales and Price (2015-2020) 11.3 2D Sales and Price (2015-2020) 11.4 Other Sales and Price (2015-2020) 12 Global Visual Effects Services Market Segment by Applications 12.1 Global Visual Effects Services Sales, Revenue and Market Share by Applications (2015-2020) 12.1.1 Global Visual Effects Services Sales and Market Share by Applications (2015-2020) 12.1.2 Global Visual Effects Services Revenue and Market Share by Applications (2015-2020) 12.2 Television Sales, Revenue and Growth Rate (2015-2020) 12.3 Theatre Sales, Revenue and Growth Rate (2015-2020) 12.4 Video Game Sales, Revenue and Growth Rate (2015-2020) 12.5 Simulator Sales, Revenue and Growth Rate (2015-2020) 12.6 Film Sales, Revenue and Growth Rate (2015-2020) 13 Visual Effects Services Market Forecast by Regions (2020-2026) 13.1 Global Visual Effects Services Sales, Revenue and Growth Rate (2020-2026) 13.2 Visual Effects Services Market Forecast by Regions (2020-2026) 13.2.1 North America Visual Effects Services Market Forecast (2020-2026) 13.2.2 Europe Visual Effects Services Market Forecast (2020-2026) 13.2.3 Asia-Pacific Visual Effects Services Market Forecast (2020-2026) 13.2.4 Middle East and Africa Visual Effects Services Market Forecast (2020-2026) 13.2.5 South America Visual Effects Services Market Forecast (2020-2026) 13.3 Visual Effects Services Market Forecast by Types (2020-2026) 13.4 Visual Effects Services Market Forecast by Applications (2020-2026) 13.5 Visual Effects Services Market Forecast Under COVID-19 14 Appendix 14.1 Methodology 14.2 Research Data Source
Inquiry For Buying
Visual Effects Services
Request Sample
Visual Effects Services